In the previous post I showed how you can Push Data into Power BI Streaming Datasets with C#. That example used dummy data. In this post I’ll show how to push performance counter data into a Power BI Streaming Dataset as a real world example. This scenario allows for monitoring a computer or application in near real time in the browser.
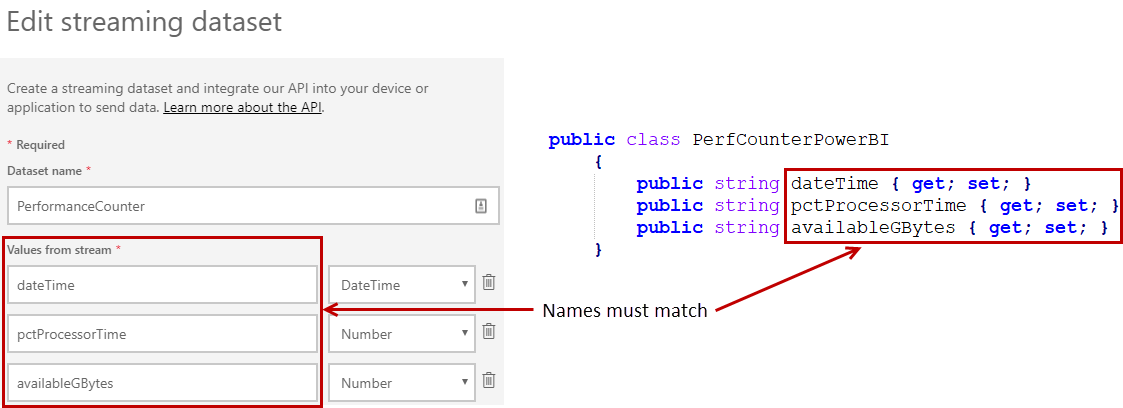
I won’t go through the steps of creating a Power BI Streaming Dataset. You can reference my previous post if you need instructions. I will note that the value names that you choose in the Streaming Dataset must match the C# property names for the script to work. This is noted in the code comments as well.
Performance Counters
If you’re not familiar with performance counters, they are a mechanism for obtaining performance data from the Windows operating system. Counters can be system wide or specific to an application. Counter data can provide great insight into performance, and you can retrieve data from a large number of counters without impacting the system.
Performance Monitor (Perfmon) is probably the most common way in Windows to view counter data, as it is easy to use and provides a nice graphical display. Thankfully it’s also easy to obtain the data with C#, which means you can do anything with it. I thought it would be fun to push the data into a Power BI Streaming Dataset and view it live in a dashboard. In this scenario, anyone with access to the dashboard can monitor system performance in near real time from anywhere.
C# Code
The code below is intended for a console application. As is, it retrieves data from two counters - % Processor Time and Available MBytes (Of memory) from the local machine. There are many dozens of counters, however, and the code could be modified for whichever ones you like. With adequate permissions, you can also obtain counter data from remote machines. There is more information on permissions later in this post.
/*
 * Retreives Performance Counter data and pushes it to a Power BI streaming dataset.
 *
 * Supply your own value for the Power BI push URL in the Main method.
 * Script run time (In minutes) and the push interval (In seconds) are supplied as command line arguments.
 *
 * The properties of the PerfCounterPowerBI class must match the Power BI Streaming Dataset value names
 * in both the class and where the object is initialized at the beginning of the while loop in the
 * PushToPowerBI method.
 */

using System;
using System.Net.Http;
using System.Threading.Tasks;
using Newtonsoft.Json;
using System.Diagnostics;
using System.Threading;

namespace PowerBiStreamPerfCounters
{
    class StreamPerfCounters
    {
        static int duration;
        static int pauseInterval;

        static HttpClient client = new HttpClient();

        // Initialize Performance Counters
        static PerformanceCounter cpuCounter = new PerformanceCounter("Processor Information", "% Processor Time", "_Total");
        static PerformanceCounter memCounter = new PerformanceCounter("Memory", "Available MBytes", "");

        static int Main(string[] args)
        {
            // Validate and assign command line arguments. Any problems
            // will result in a return value of 1, which ends the script.
            if (HandleArguments(args) == 1)
            {
                return 1;
            }

            // Get the push URL by clicking on the "API Info" button for your streaming dataset
            const string pushUrl = "<Power BI push (Post) URL>";

            PushToPowerBI(pushUrl, duration, pauseInterval);
            return 0;
        }

        public static int HandleArguments(string[] args)
        {
            if (args.Length != 2)
            {
                Console.WriteLine("Please enter two numeric arguments - script run time in minutes and push interval in seconds.");
                Console.WriteLine("Usage: StreamPerfCounters 120 2");
                Console.WriteLine("Press any key to continue.");
                Console.ReadKey();
                return 1;
            }

            bool arg0Test = int.TryParse(args[0], out duration);
            bool arg1Test = int.TryParse(args[1], out pauseInterval);
            if (arg0Test == false || arg1Test == false)
            {
                Console.WriteLine("Failed to convert command line argument to a number. Both arguments must be numeric.");
                Console.WriteLine("Usage: StreamPerfCounters 120 2");
                Console.WriteLine("Press any key to continue.");
                Console.ReadKey();
                return 1;
            }

            return 0;
        }

        public static void PushToPowerBI(string url, int duration, int pauseInterval)
        {
            DateTime startTime = GetDateTimeUtc();
            DateTime currentTime = GetDateTimeUtc();

            while ((currentTime - startTime).TotalMinutes <= duration)
            {
                PerfCounterPowerBI perfCounterPowerBI = new PerfCounterPowerBI
                {
                    dateTime = GetDateTimeUtc().ToString("yyyy-MM-ddTHH:mm:ss.fffZ"),
                    pctProcessorTime = cpuCounter.NextValue().ToString(),
                    availableGBytes = (memCounter.NextValue() / 1024).ToString(),
                };

                var jsonString = JsonConvert.SerializeObject(perfCounterPowerBI);

                // Add brackets for Power BI
                var postToPowerBi = HttpPostAsync(url, "[" + jsonString + "]");

                Console.WriteLine(jsonString);

                // Pause for n seconds. Not a high degree of precision.
                Thread.Sleep(pauseInterval * 1000);
                currentTime = GetDateTimeUtc();
            }
        }

        public class PerfCounterPowerBI
        {
            // Property names must match Power BI Streaming Dataset value names
            public string dateTime { get; set; }
            public string pctProcessorTime { get; set; }
            public string availableGBytes { get; set; }
        }

        static async Task<HttpResponseMessage> HttpPostAsync(string url, string data)
        {
            // Construct an HttpContent object from StringContent
            HttpContent content = new StringContent(data);
            HttpResponseMessage response = await client.PostAsync(url, content);
            response.EnsureSuccessStatusCode();
            return response;
        }

        static DateTime GetDateTimeUtc()
        {
            return DateTime.UtcNow;
        }
    }
}
If you want to retrieve counter data from a remote machine, the machine name is supplied as the 4th argument to the PerformanceCounter constructor.
public PerformanceCounter (string categoryName, string counterName, string instanceName, string machineName);
Permissions
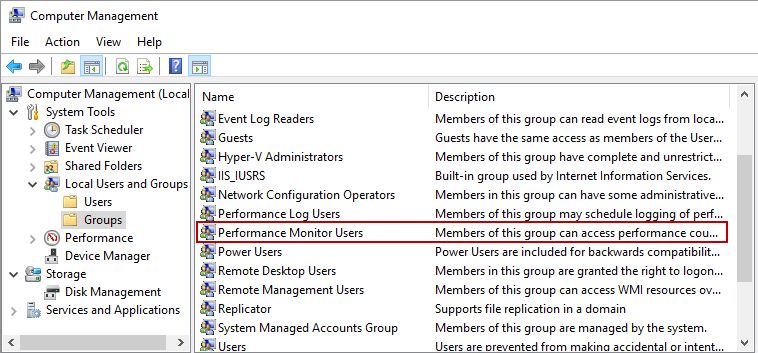
To access Performance Counters, you need to be a member of the “Performance Monitor Users” group on the target machine. So if you want to access counters on server_x, you need to be a member of the “Performance Monitor Users” group on server_x. On Windows 10, you can find local groups via the Computer Management app. The similarly titled group “Performance Log Users” gives you access to performance counters, and also allows you to create Data Collector sets.
Running the Script
After building your app, you will have an executable (exe) file in your project’s bin\Debug folder that you can run in the console as shown below. It accepts two arguments:
- How long you want the script to run in minutes.
- Push frequency in seconds.
In this example, the script would run for 120 minutes and push data every 2 seconds. It will also output the data to the console while it runs.
C:\<Path to project>\bin\Debug>PowerBiStreamPerfCounters.exe 120 2
{"dateTime":"2017-12-26T18:02:21.748Z","pctProcessorTime":"0","availableGBytes":"2.34668"}
{"dateTime":"2017-12-26T18:02:23.964Z","pctProcessorTime":"5.942539","availableGBytes":"2.344727"}
{"dateTime":"2017-12-26T18:02:25.966Z","pctProcessorTime":"0.9021741","availableGBytes":"2.342773"}
{"dateTime":"2017-12-26T18:02:27.969Z","pctProcessorTime":"3.244029","availableGBytes":"2.342773"}
{"dateTime":"2017-12-26T18:02:29.971Z","pctProcessorTime":"1.475104","availableGBytes":"2.342773"}
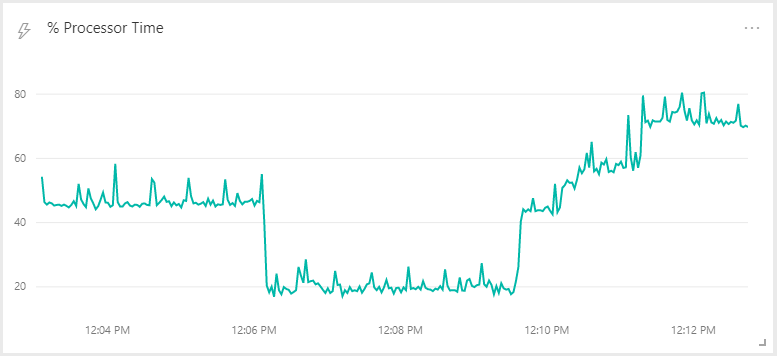
If it’s running and outputting data to the console, that must mean that the Power BI Streaming Dataset is configured correctly. The screenshot below shows an example of what the % Processor Time counter looks like in a dashboard. I used a CPU stress tool from Sysinternals to simulate different processor loads.

Other Thoughts
Changing counters in this script requires editing the code in multiple places, which is not ideal. I’ve done some work on another version that uses a JSON configuration file, which allows for making changes without touching the code at all. It’s more complicated, however, and I thought this would be an easier example to start with.
Monitoring SQL Server Analysis Services (SSAS) in real time was my motivation for writing this. If you’re interested in SSAS monitoring, you should check out Shabnam Watson’s post titled “Build a Performance monitoring tool for SSAS using Power BI”. The book “Tabular Modeling in Microsoft SQL Server Analysis Services (2nd Edition)” by Marco Russo and Alberto Ferrari also has great information about Performance Counters related to SSAS.
References
- PerformanceCounter Class
- Overview of Windows Performance Monitor (Permissions information)